714 editable PowerPoint slides · browse free · download from ₹99
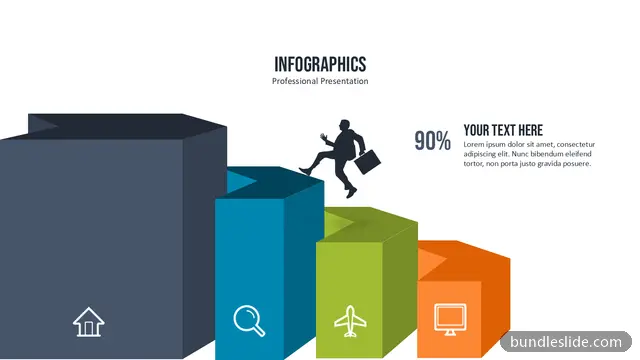
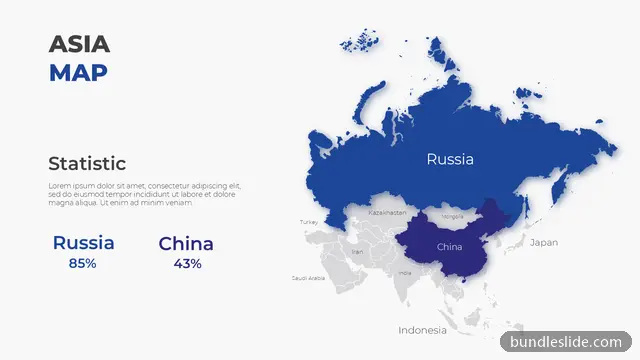
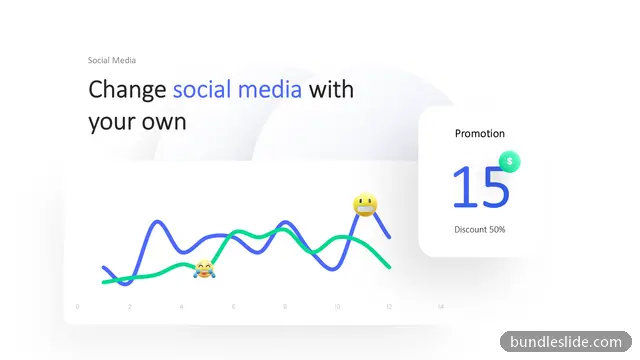
A statistics slide makes one or a few important numbers stand out: growth percentages, market size, survey results or customer counts. Big, clear figures stay in the audience's memory far longer than a table.
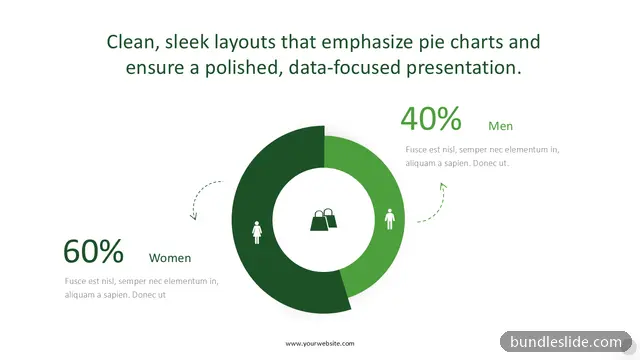
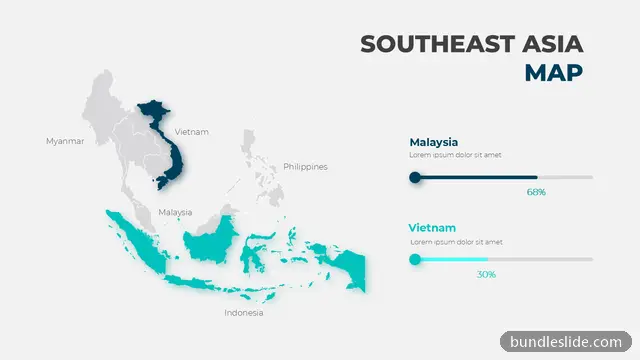
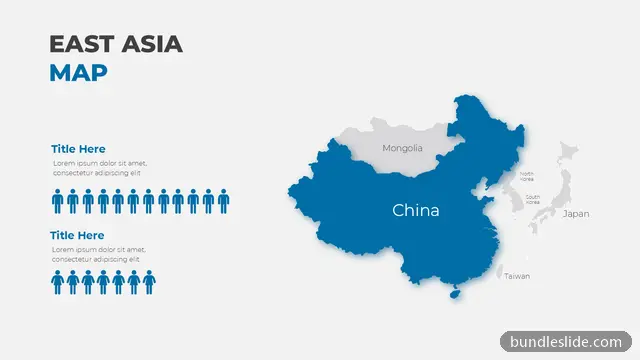
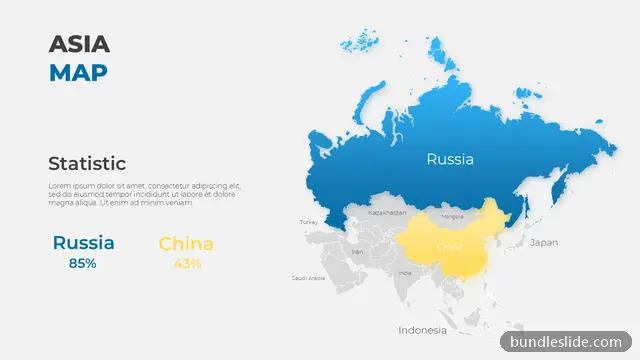
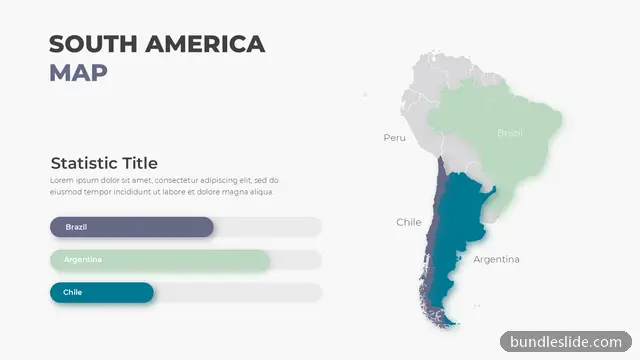
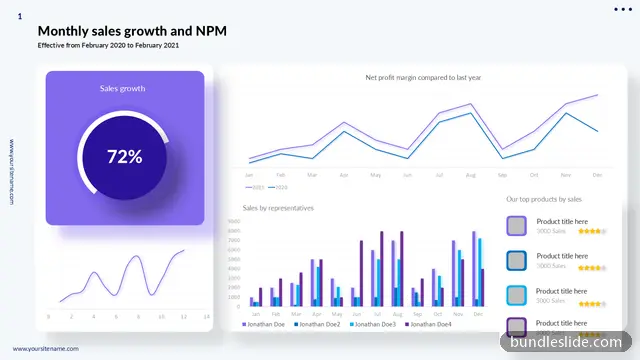
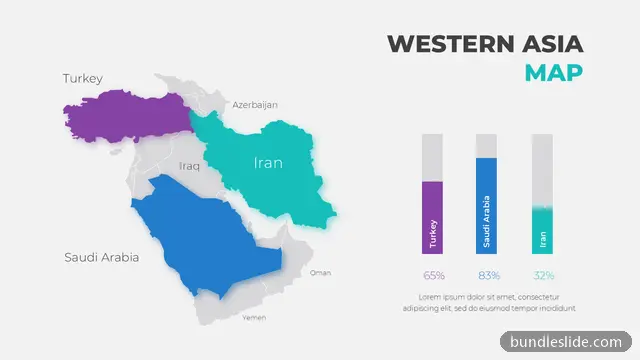
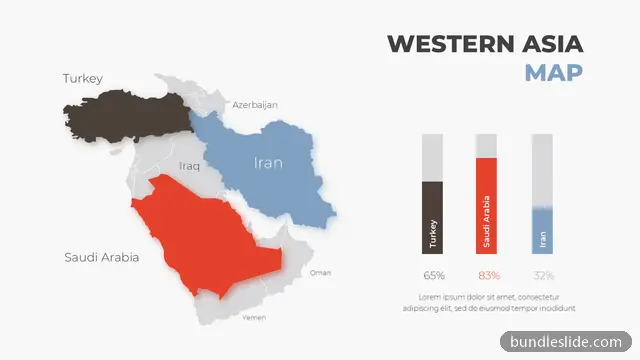
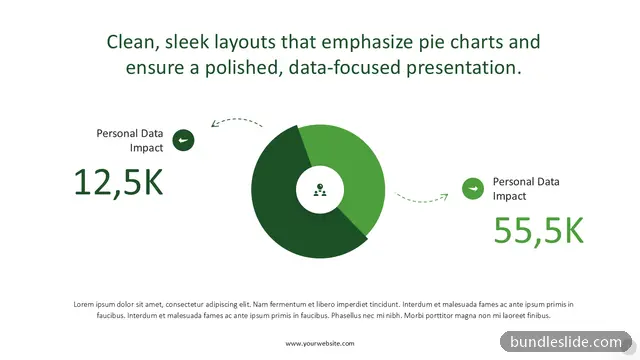
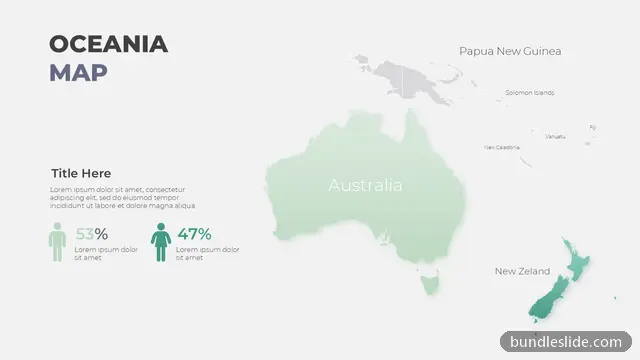
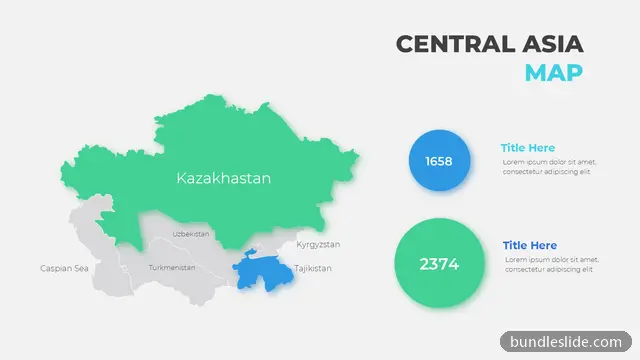
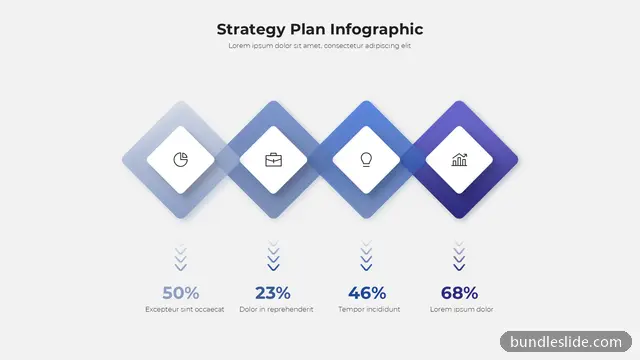
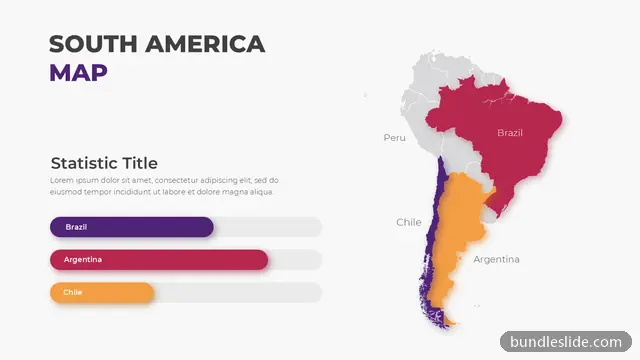
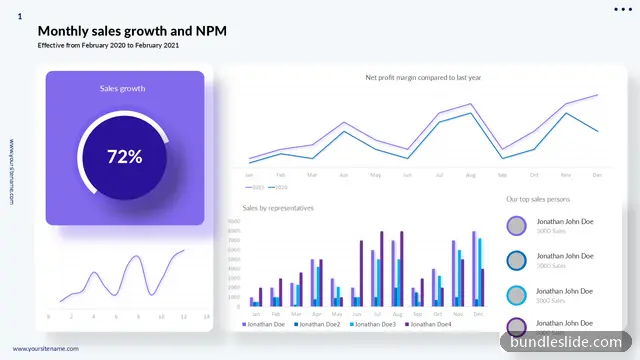
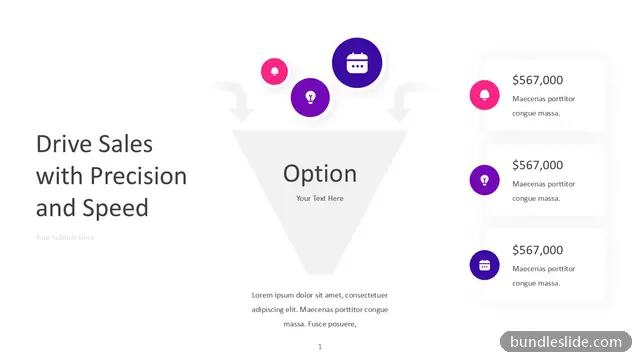
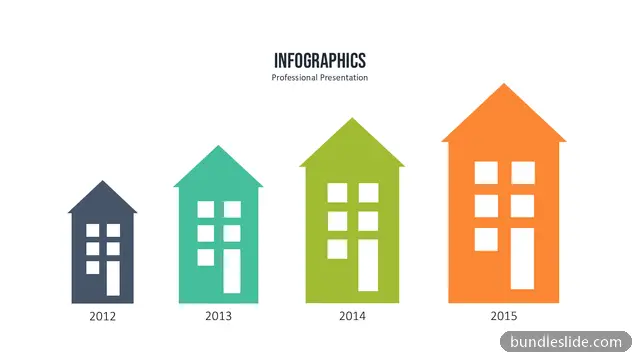
These designs use large number callouts, percentage rings, progress bars, icons and people graphics, so each figure gets the attention it deserves. Replace the sample numbers with your own and keep the layout.
One to four key figures work best. If you have more data, use a chart slide instead and keep the statistics slide for the headline numbers.
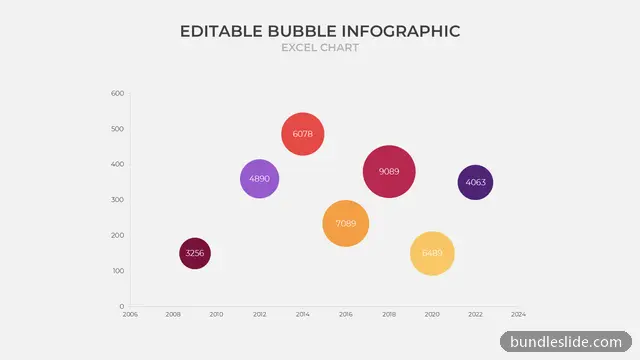
Yes. The shapes are editable, and many chart-based designs are real PowerPoint charts, so the graphic follows the value you type.
Yes. Every slide is a real PowerPoint (.pptx) file, not a picture. You can change the text, colours, icons and layout, and add your own logo, just like any slide you made yourself.
Microsoft PowerPoint gives the best result. The files also open in Google Slides and WPS Office, though some fonts may look slightly different there.
Browsing and searching the whole library is free. Downloading needs a SmartSearch pass, from ₹99 for 30 days of unlimited downloads. It's a one-time payment with no auto-renewal.