419 editable PowerPoint slides · browse free · download from ₹99
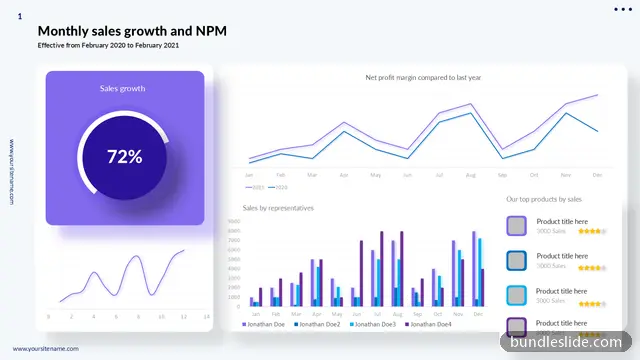
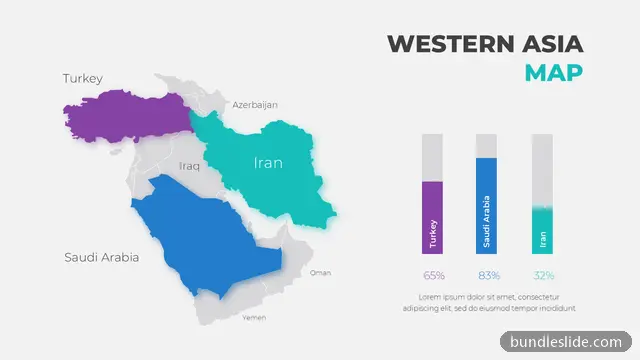
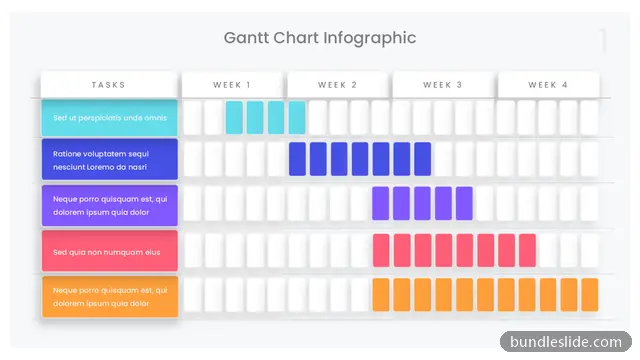
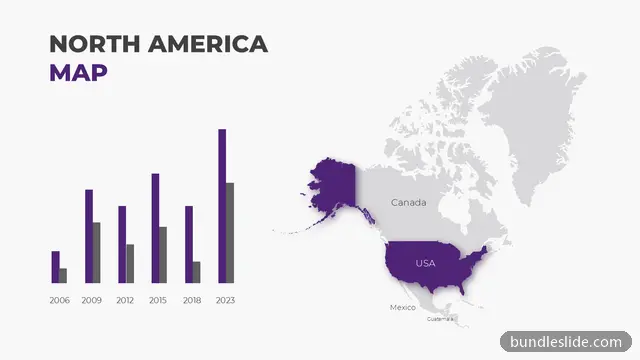
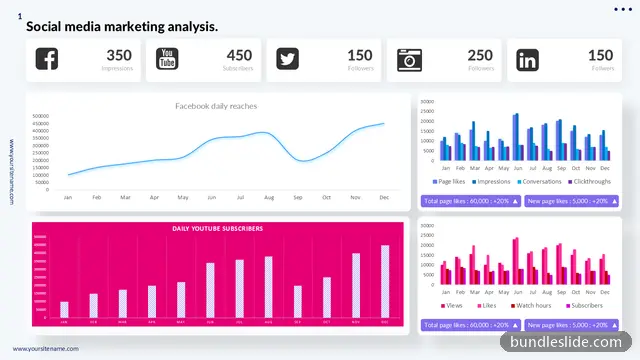
Data chart slides turn rows of numbers into a picture: sales over the year, market share, budget split or survey results. A well-designed chart lets the audience see the trend before you explain it.
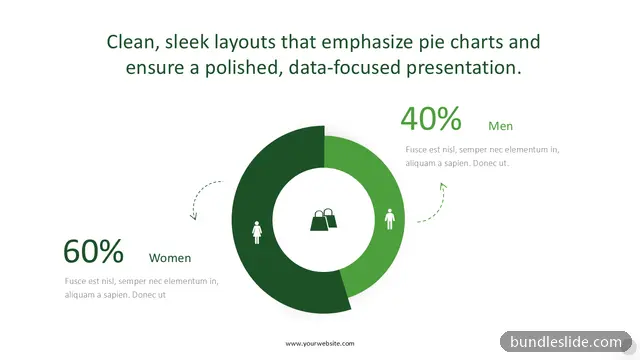
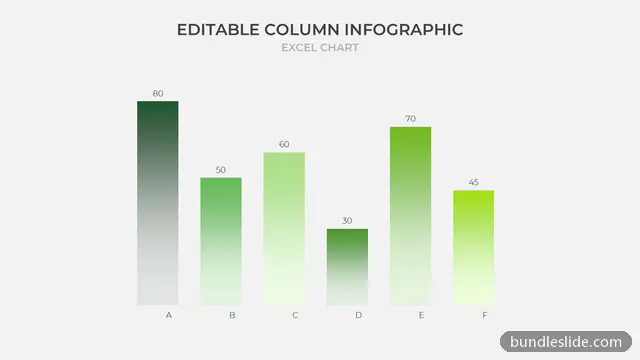
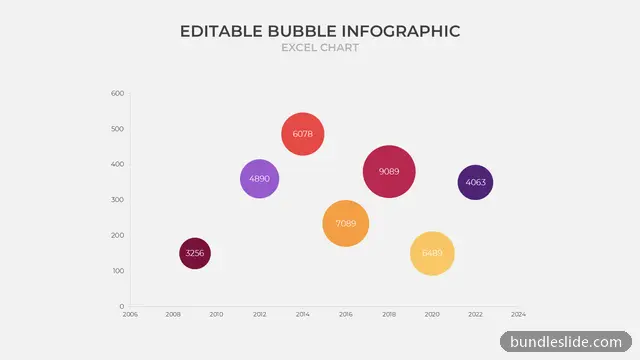
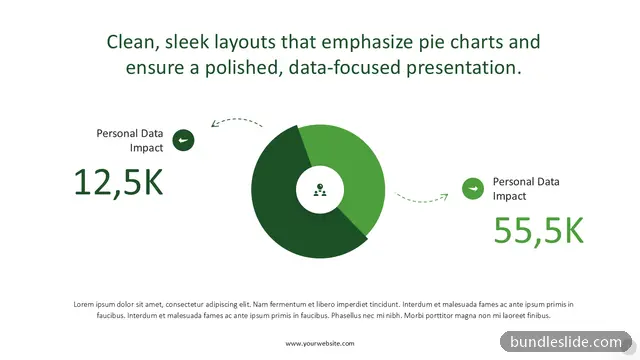
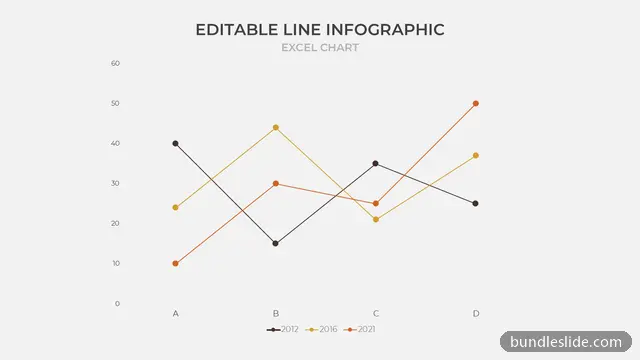
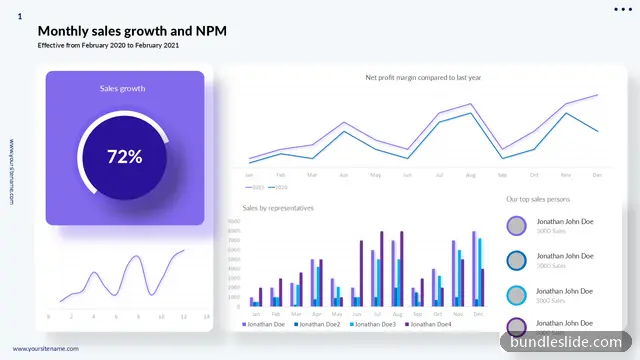
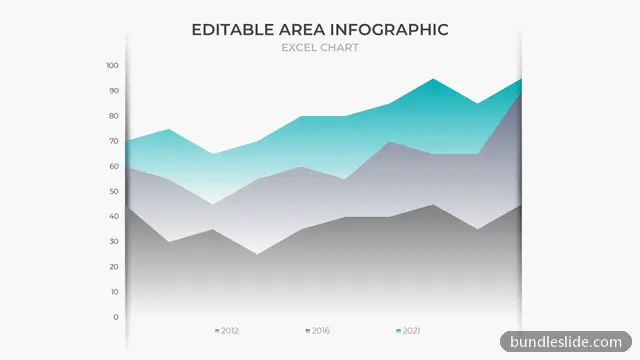
These templates cover line, pie, donut, area and combination charts in professional colour schemes. Where a slide uses a real PowerPoint chart, you can type your numbers into its data sheet and the chart updates itself.
Yes. For chart-based slides, right-click the chart and choose Edit Data. Type or paste your figures and the chart redraws automatically.
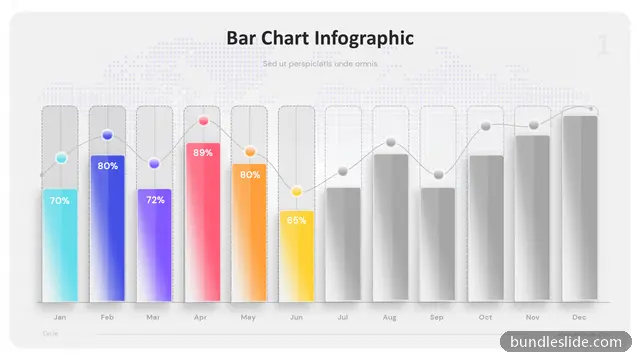
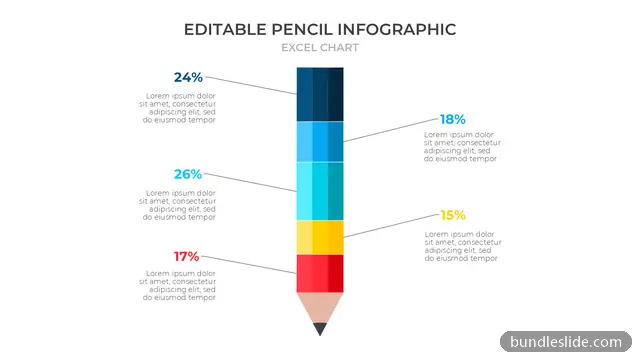
Line charts for trends over time, bar charts to compare amounts, pie or donut charts for parts of a whole (up to about 6 parts).
Yes. Every slide is a real PowerPoint (.pptx) file, not a picture. You can change the text, colours, icons and layout, and add your own logo, just like any slide you made yourself.
Microsoft PowerPoint gives the best result. The files also open in Google Slides and WPS Office, though some fonts may look slightly different there.
Browsing and searching the whole library is free. Downloading needs a SmartSearch pass, from ₹99 for 30 days of unlimited downloads. It's a one-time payment with no auto-renewal.