269 editable PowerPoint slides · browse free · download from ₹99
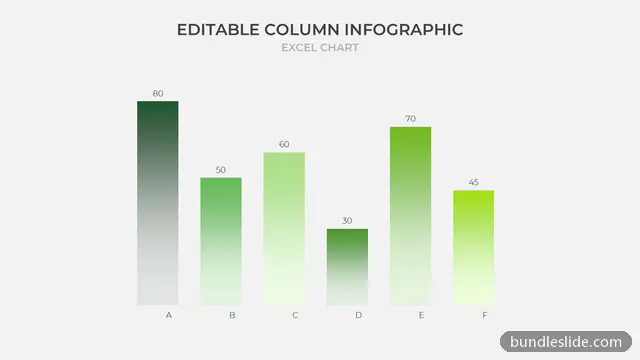
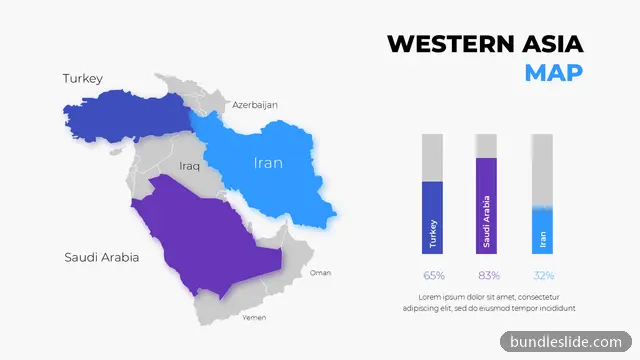
Bar and column charts are the clearest way to compare amounts: sales by region, revenue by quarter, survey answers or target vs achievement. Most monthly and quarterly reviews need at least one.
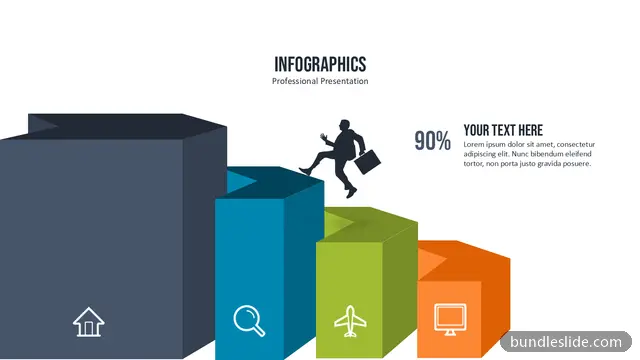
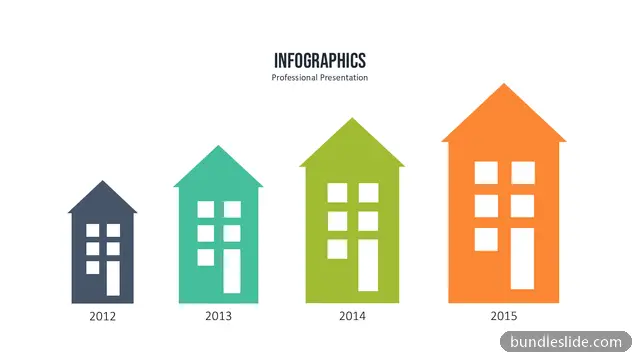
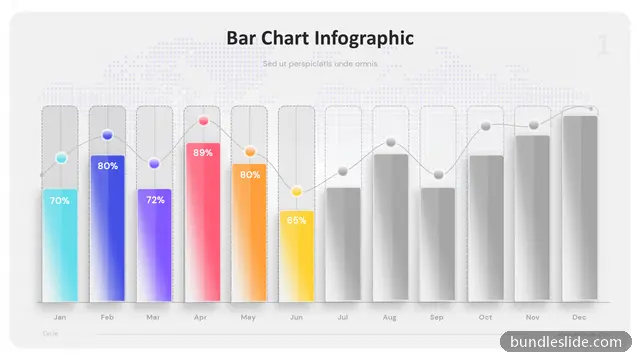
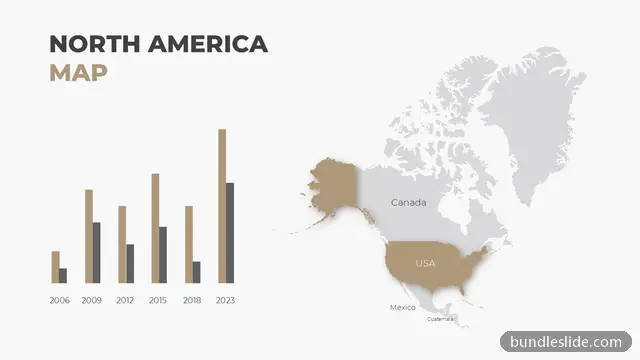
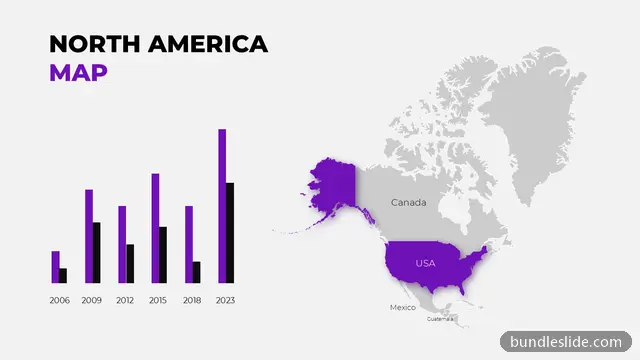
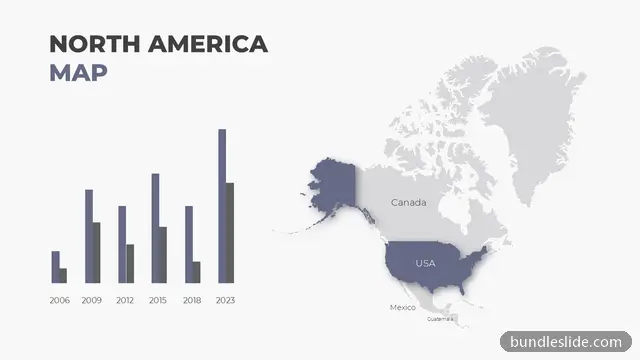
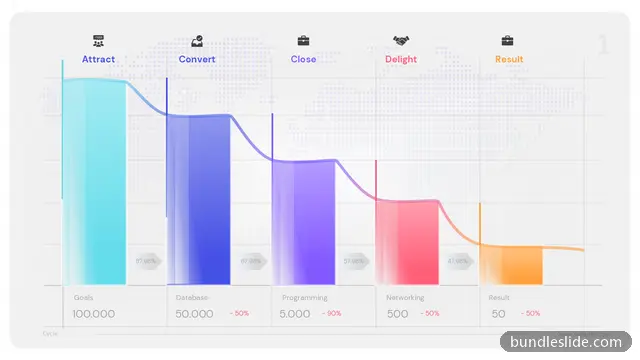
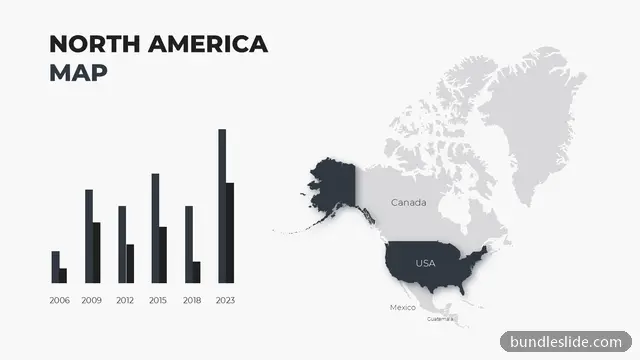
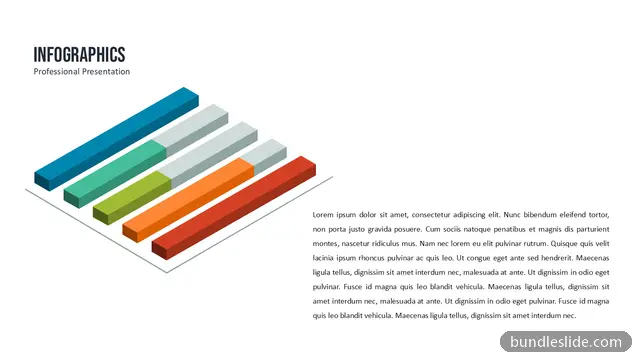
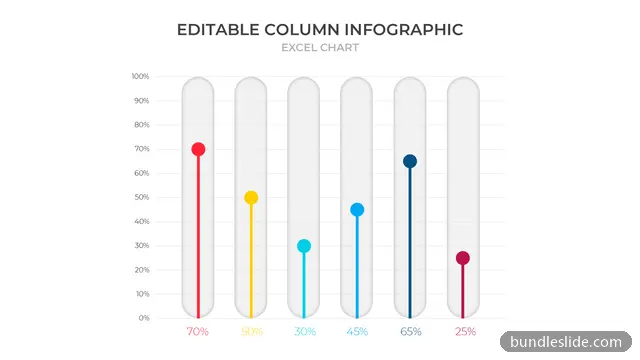
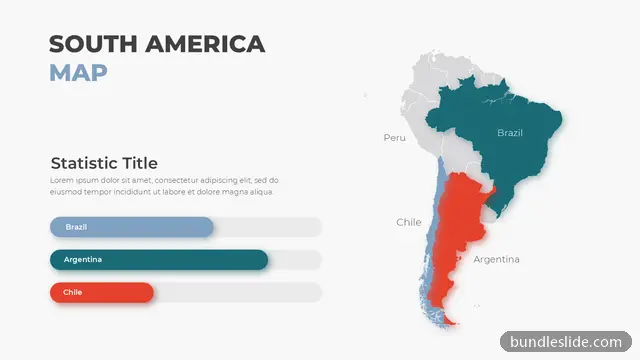
This collection includes vertical columns, horizontal bars, stacked and grouped bars, and infographic-style bars with icons. Use the chart designs with your own figures and keep the professional styling.
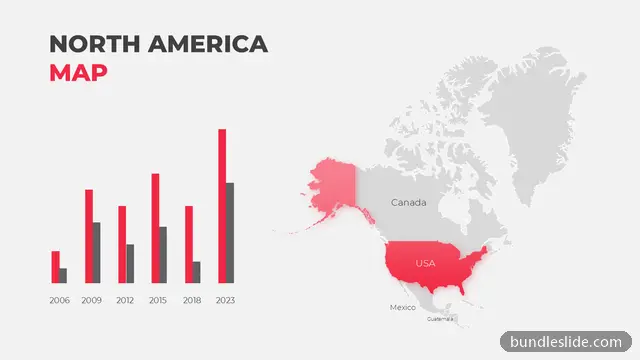
Vertical columns suit time periods (months, quarters). Horizontal bars suit long category names, like products or regions.
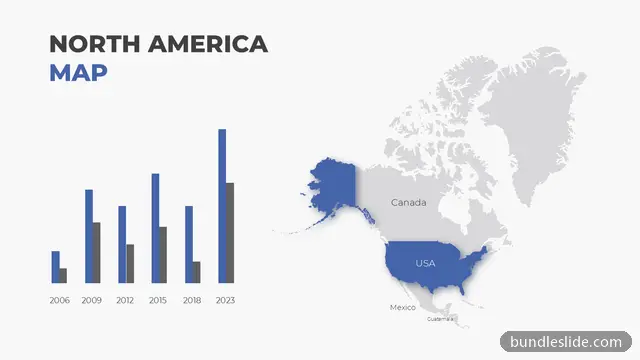
Yes. A grouped or stacked bar design shows two values per category side by side.
Yes. Every slide is a real PowerPoint (.pptx) file, not a picture. You can change the text, colours, icons and layout, and add your own logo, just like any slide you made yourself.
Microsoft PowerPoint gives the best result. The files also open in Google Slides and WPS Office, though some fonts may look slightly different there.
Browsing and searching the whole library is free. Downloading needs a SmartSearch pass, from ₹99 for 30 days of unlimited downloads. It's a one-time payment with no auto-renewal.